Half life graphs
A half life graph plots the activity of a radioactive source against time, and the graph builder draws it for twelve real isotopes from technetium-99m to uranium-238. Switch on the half-life line and a dashed construction drops from half the starting activity to the time axis, so the class reads the half-life off the graph the way the exam expects.
A hand-built replica of the real builder page, not a screenshot. Every control shown exists in the product.
Part of the Graph builder family. See Velocity time graphs, IV characteristic graphs, Infrared radiation graphs and Distance time graphs pages to explore further.
Why this works in Physics
Reading data from a graph is an key aspect of the Physics curriculum. Half-lives are one of the most intuitive concepts when presented correctly.
The usual slip is reading the time for the activity to reach zero, or halving the time axis instead of the activity axis, which is easier to combat with GCSE exam paper standard graphs than a sketched graph. Download graphs to add your worksheets or assessments, or use them in questions presented within Plenary Studio with a free account.
Half life graphs for three isotopes
Every image here is free to use in your teaching under our image licence.
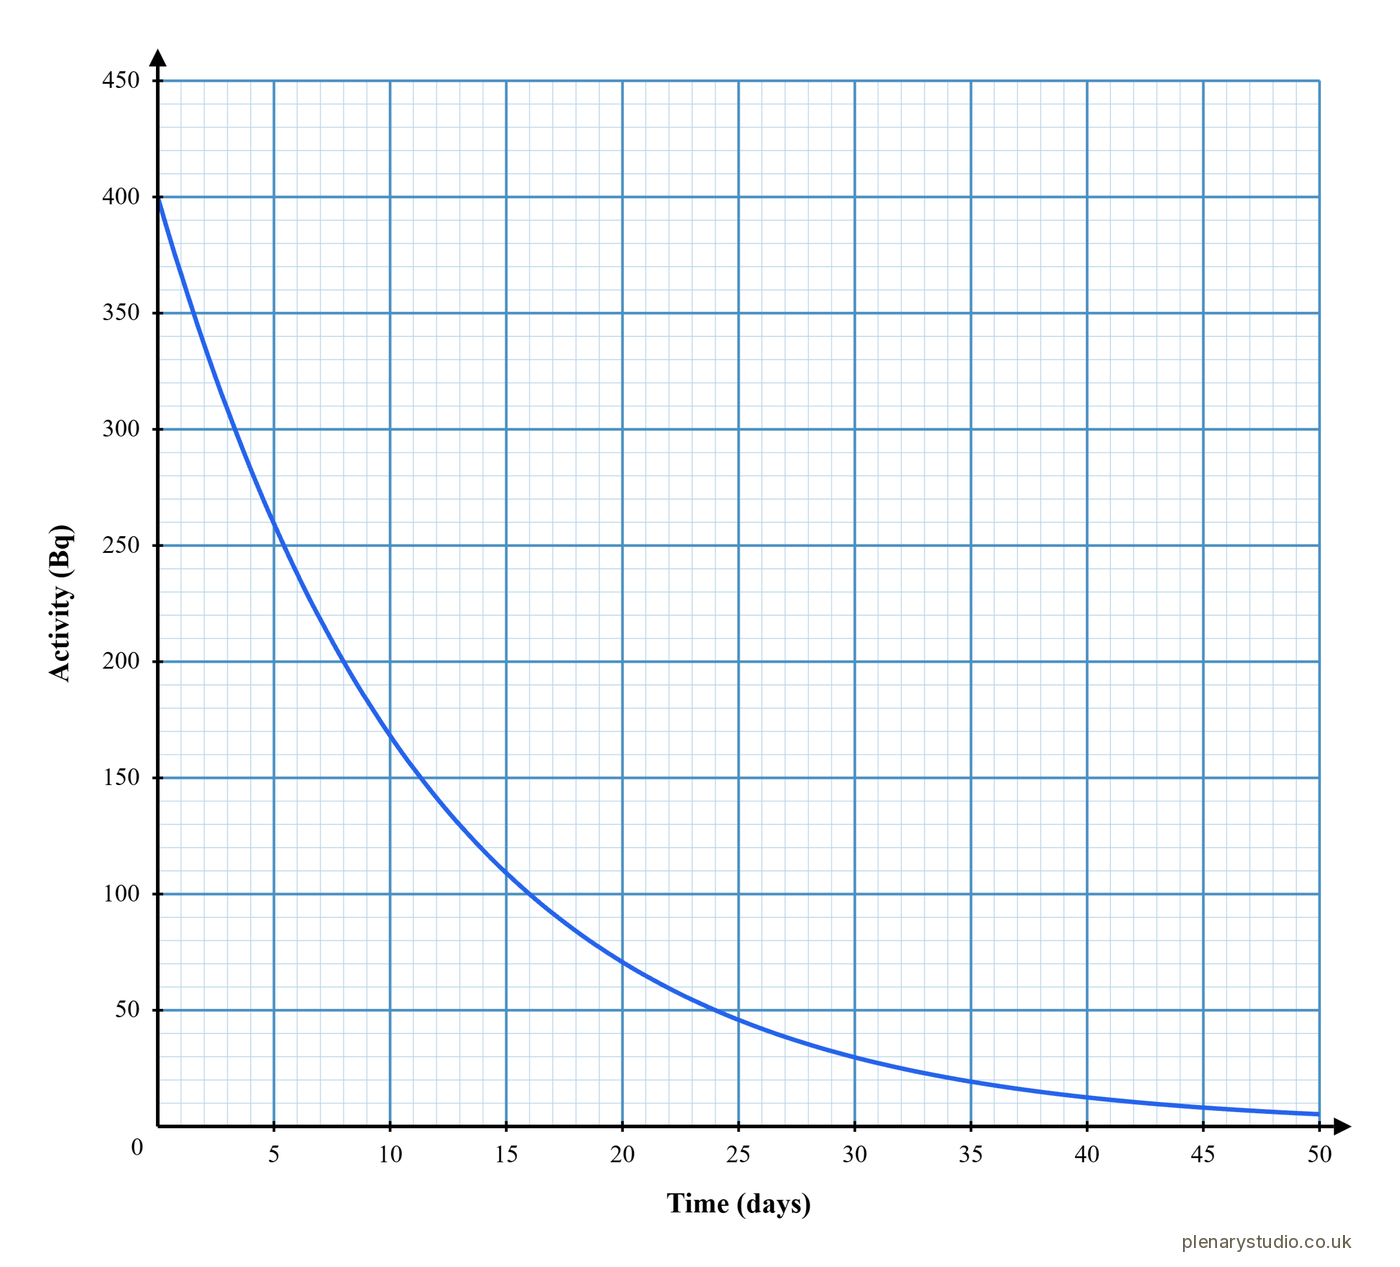
Iodine-131 decaying from 400 Bq, with a half life of 8 days.Download image, Iodine-131 decaying from 400 Bq, with a half life of 8 days. 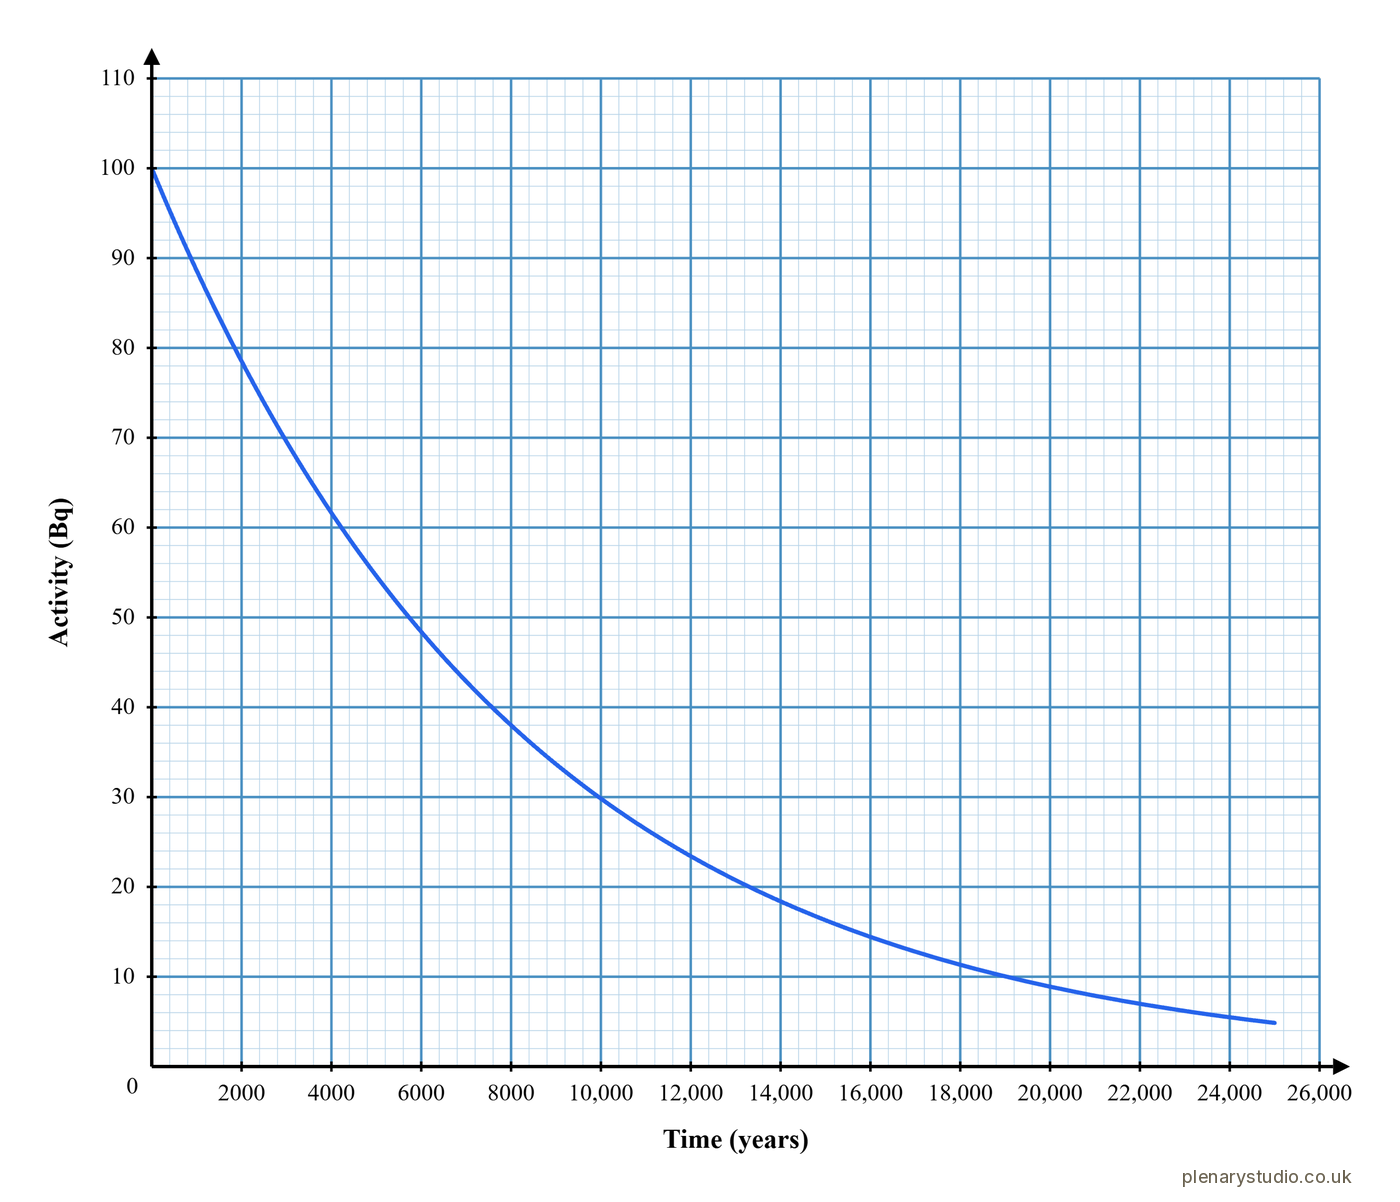
Carbon-14 on a time axis in years, the same curve on a very different scale.Download image, Carbon-14 on a time axis in years, the same curve on a very different scale. 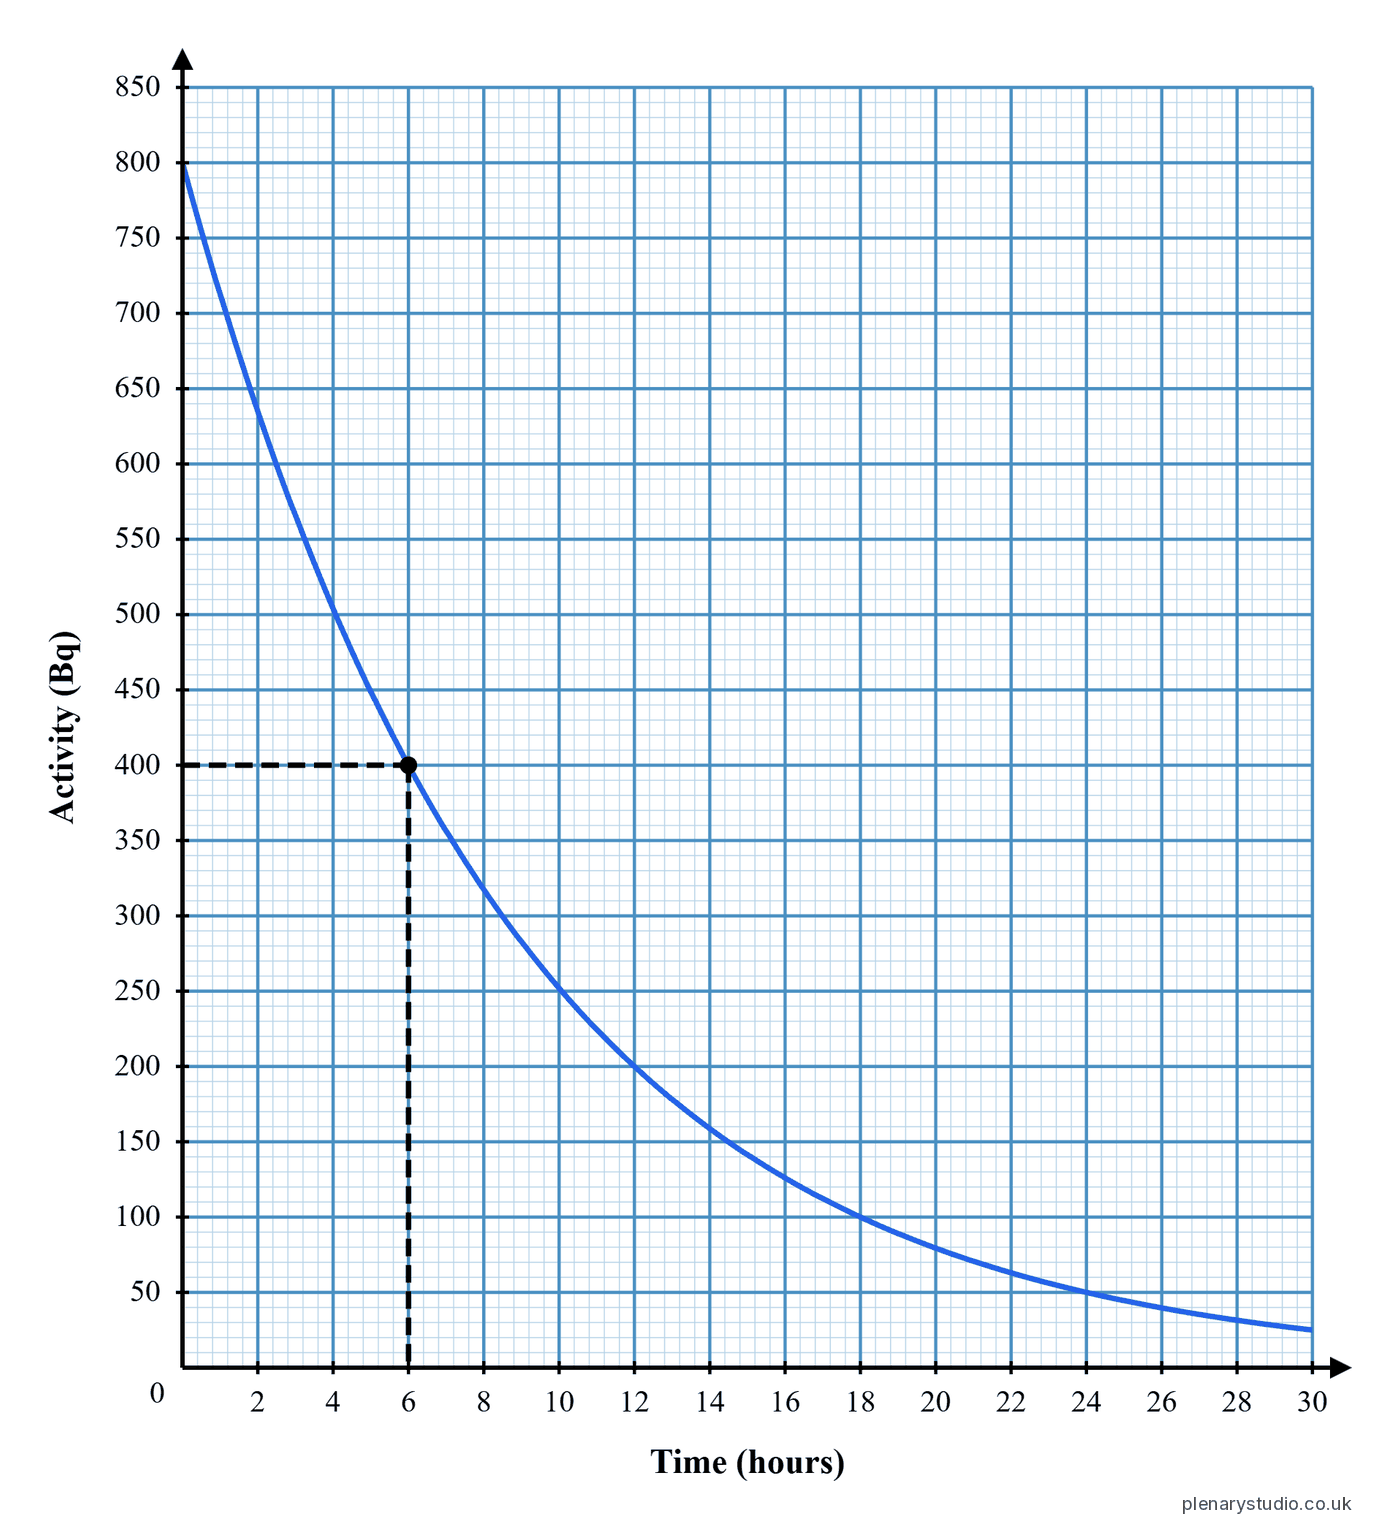
The construction pupils draw to read a half life, from half the starting activity down to the time axis.Download image, The construction pupils draw to read a half life, from half the starting activity down to the time axis.
More Physics resources
Multiple choice questions
Diagnostic multiple choice. Each answer reveals what the class does and doesn't understand.
Click to reveal
Answers revealed when you click. Great for starters or extension questions.
Keyword matching
Match keywords to their definitions. Great for prior learning or end-of-lesson review.
Visual tools
Every tool turns a few inputs into a clean, exam-ready diagram.
Velocity time graphs
Braking, acceleration and terminal velocity scenarios on GCSE graph paper, with the area under the line as distance.
IV characteristic graphs
Ohmic conductor, filament lamp and diode on symmetric axes, the required practical graphs in one click.
Infrared radiation graphs
Heating to equilibrium and cooling curves for matt black, matt white and shiny silver surfaces.
Distance time graphs
Journeys you edit point by point on GCSE graph paper, with a tangent tool that reads the speed off the gradient.
Equation builder
Equation selection, rearrangement and substitution practice, step by step.
Forces builder
Free-body diagrams, resolve into components, find the resultant on GCSE graph paper.
Momentum builder
Before and after collision diagrams with selectable unknowns and a step-by-step reveal.
Ray diagrams (lenses)
Graph-paper lens, focal points and object for teaching ray construction.
Radiation equation
Curated GCSE nuclear equations covering alpha, beta, fission, fusion and decay chains.
Circuit diagrams
Build circuits from standard GCSE symbols and components.
Science table
Practical results tables with repeat readings, a mean and an optional anomaly, plus curated reference data.
Diagram labeller
Upload any diagram and the labels are suggested for you to drag, edit and blank.
Teach with us
and start building.
Plenary Studio is open to every UK secondary teacher. Sign up free, no card details, and build your first resource in minutes. Join the new wave of teachers bringing Plenary Studio into their classroom.
One inbox, no marketing list. We read every email.
Say hello.
We’d love to hear from teachers, heads of department, and anyone curious about where this is going.
hello@plenarystudio.co.ukOpens your email client. Nothing is sent to us until you press send there.