Enzyme activity graphs
Enzyme activity against temperature is the required practical graph, and the graph builder draws it for human amylase, pepsin, a plant amylase and a thermophilic enzyme. Switch to experimental data and add an anomaly for the class to circle.
A hand-built replica of the real builder page, not a screenshot. Every control shown exists in the product.
Part of the Graph builder family. See Photosynthesis light intensity graphs page to explore further.
Why this works in Biology
The shape is the marks, the gentle rise to the optimum, the peak, then the steep collapse as the active site denatures. A sketch gets the idea across, but reading an optimum off a graph takes an exam standard one, and this is drawn from the data, so the peak sits exactly where the enzyme puts it.
Experimental mode scatters the readings around the curve and lifts one clear anomaly, which is the required practical question in one picture, which point would you leave out and why. Download it for a worksheet or use it in questions within Plenary Studio with a free account.
Enzyme activity graphs for three enzymes
Every image here is free to use in your teaching under our image licence.
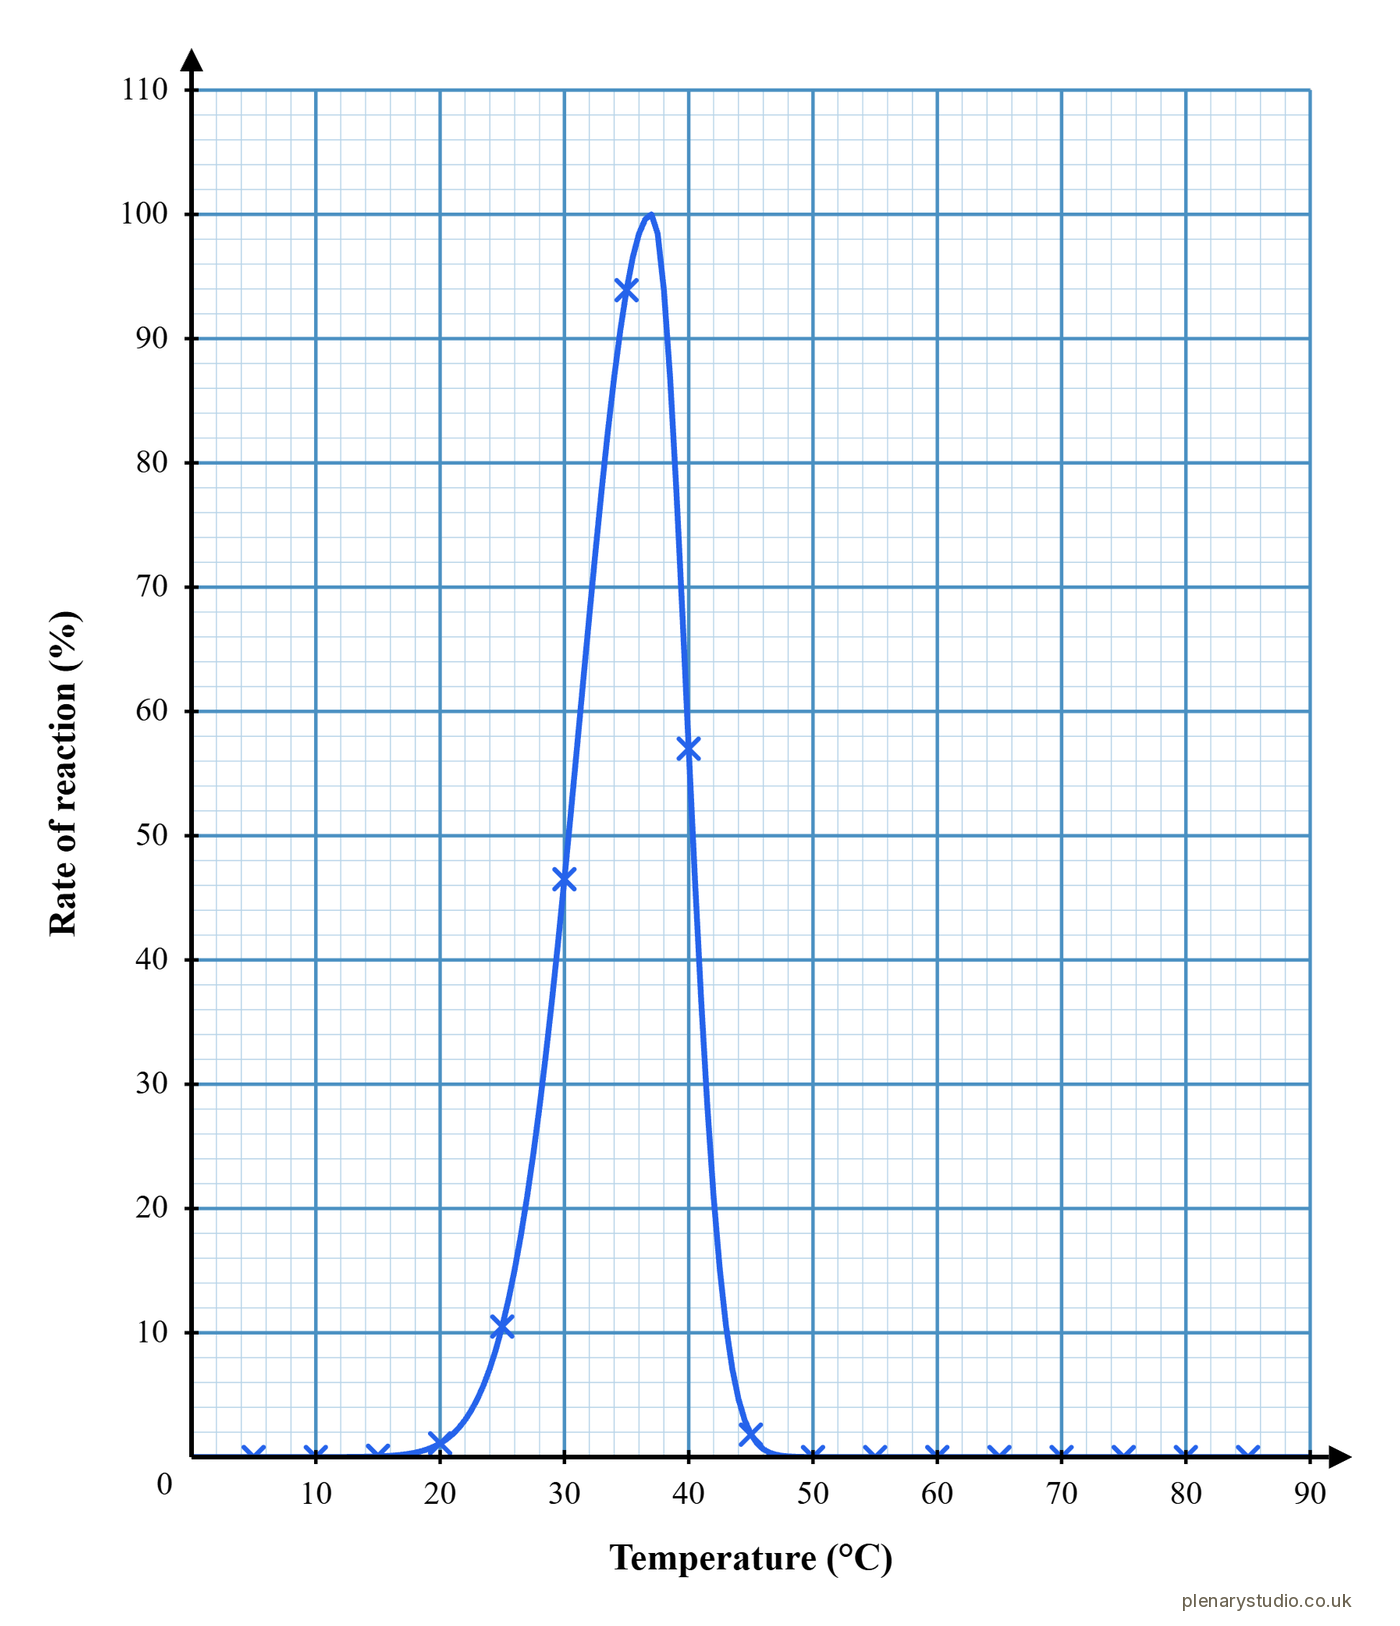
Human amylase, fastest around body temperature, then falling sharply as it denatures.Download image, Human amylase, fastest around body temperature, then falling sharply as it denatures. 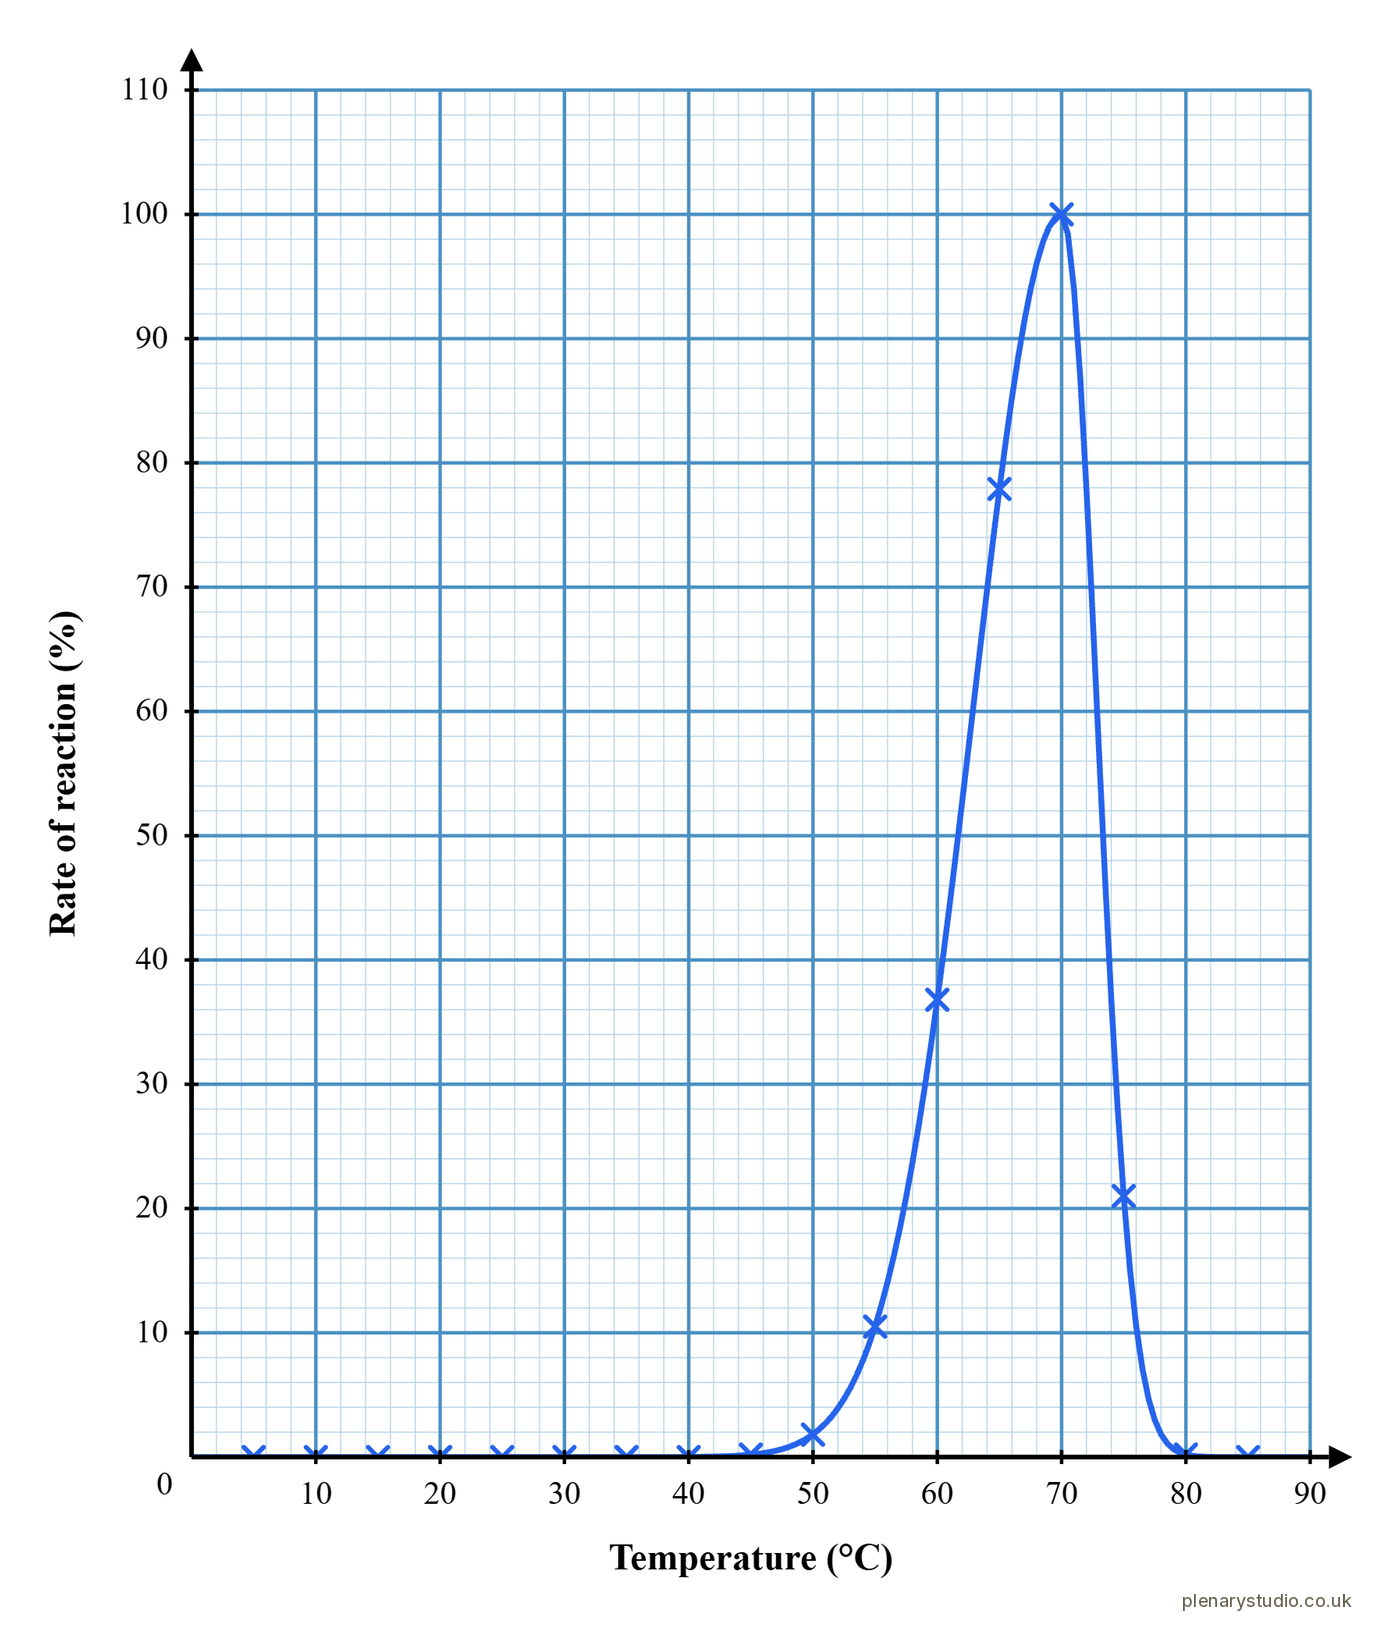
A thermophilic enzyme, the same shape shifted to a much higher optimum.Download image, A thermophilic enzyme, the same shape shifted to a much higher optimum. 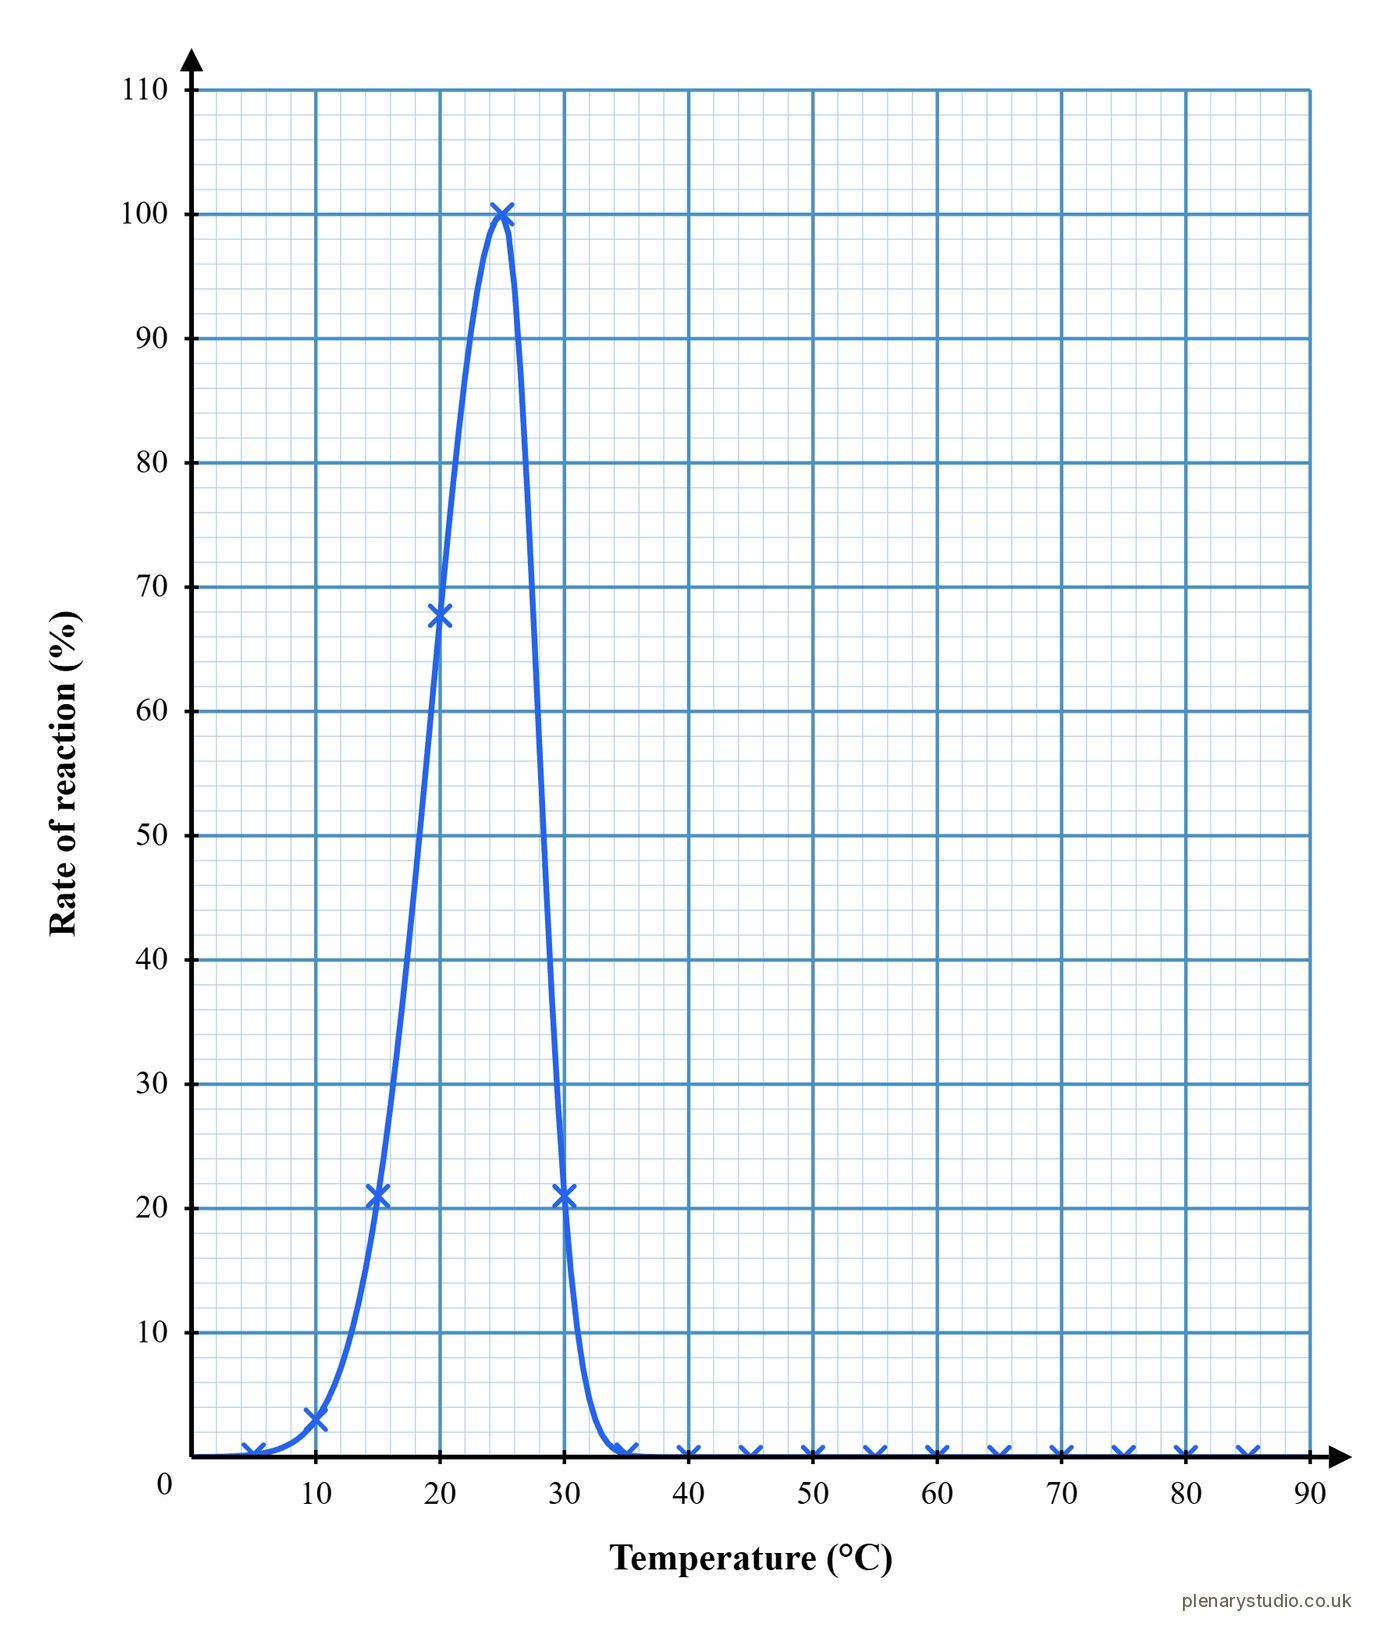
A plant enzyme, the same shape with a lower optimum than human amylase.Download image, A plant enzyme, the same shape with a lower optimum than human amylase.
More Biology resources
Click to reveal
Answers revealed when you click. Great for starters or extension questions.
Gap-fill paragraph
Generate or paste a paragraph, then auto- or hand-pick the gaps. Great for mini-whiteboard tasks.
Stimulus questions
Questions beside a visual stimulus. A YouTube clip, diagram, graph, or a paragraph to read closely.
Memorise and recall
Automate show, cover, and recall tasks. Great for memorising diagram features or keywords.
Visual tools
Every tool turns a few inputs into a clean, exam-ready diagram.
Photosynthesis light intensity graphs
Rate against light intensity at three carbon dioxide levels or temperatures, the limiting factor graph in one click.
Science table
Practical results tables with repeat readings, a mean and an optional anomaly, plus curated reference data.
Diagram labeller
Upload any diagram and the labels are suggested for you to drag, edit and blank.
Teach with us
and start building.
Plenary Studio is open to every UK secondary teacher. Sign up free, no card details, and build your first resource in minutes. Join the new wave of teachers bringing Plenary Studio into their classroom.
One inbox, no marketing list. We read every email.
Say hello.
We’d love to hear from teachers, heads of department, and anyone curious about where this is going.
hello@plenarystudio.co.ukOpens your email client. Nothing is sent to us until you press send there.